Trying to find product/market fit

Vonto
Vonto is an app for small business owners that connects to business apps and generates insights from this data. Vonto had been in the market for around 18months when I came onto the team to help them pivot and attempt to find a better product/market fit after it became clear the existing product was not working. This is how we went about trying to pivot, how we ultimately failed, and what I learned.

The problem

Vonto had been in the market for 18 months, with a target persona of small business owners in retail, e-commerce and hospitality. However, despite being free, the business was failing to meet expectations with regards to active users, engagement, or retention. Roam has been closely involved with Vonto throughout its life, and I joined the team after a series of smaller product updates and marketing pushes failed to impact any of these main metrics and it was decided a more substantial pivot would be needed.
Vonto was failing to find product/market fit. With poor numbers of active users, engagement or retention

Problem statement: Vonto was failing to find product/market fit. With poor numbers of active users, engagement or retention.

Background research

Vonto had evolved over several years and a range of iterations and had some quantitative analytics we could lean on to guide our initial direction. Previously the North Star metric for the product had been defined as the number of users with 2 or more connections, based on the observation that these people had the highest retention and got the most value from Vonto. However, background research into our existing customers (conducted by our product manager) did not reveal any clear patterns around highly engaged users or demographics.

In an ideal world, we would have liked to be able to segment our audience into users who were getting a lot of value from Vonto, those who were getting some value, and those who weren't a good fit. This would have enabled us to advertise to other people similar to those in category one, and build features and experiences aimed at converting those finding some value into more engaged, high-value customers. Unfortunately, this was not the case, and we decided to pursue a much wider scope of redesign to look for a new target market and a new product offering.

Refining our target market

Design process graphic

Initial steps of design process

The first step in this process was to conduct a range of interviews with existing and potential new target customers. I worked with the rest of the design and product team to interview 15 small business owners to discuss with them their pain points around managing their business, with a particular focus on business data and metrics.

After talking to customers from retail, hospitality and tech we went through a process of theming and creating empathy maps for each of our target markets. We found many commonalities in goals and pains across tech founders (as well as other businesses) e.g. many founders feeling like finances were a chore or a difficulty, instead wanting to focus on building their product or business. However we also found out how different the contexts of these industries are, of particular relevance to Vonto: the types of business tools, key metrics and business models were very different between tech, retail and hospitality.

Aside from simply helping us look for new potential markets to pivot towards, these interviews also provided us a range of insights around problems, goals and contexts that we could take forward into the upcoming solution design phase.

‍

Pivoting to tech

After this initial research, we made the decision to explore the tech industry as a new direction. Our findings indicated frustration with finances (it being seen as boring, distracting admin work), difficulty staying aware of all their different metrics, and importantly: a high usage of digital tools that Vonto could integrate with.

Design process graphic

Empathy map of tech persona following initial ~15 interviews.

Forming problem statements

After this initial round of research, I organised and facilitated a workshop to go through a process of forming problem statements that we wanted to test for, and an ideation exercise to come up with solutions to these problems. We reviewed the research from the most recent interviews, alongside a review of competitors in the tech space, and a review of key problems previously identified in old Vonto research.

We brainstormed and voted on our key problems that Vonto could address and created a range of "how might we..?" statements based on these. From there we brainstormed a range of features and voted on which of these to test.
Problem statement post-its

Testing the customer problem & solution

To test our assumptions around the key problems to try to solve we conducted a further 8 interviews/tests with people in our target demographic (founders at small tech startups). These consisted of a 30min chat to start with in order to understand if these were really problems founders faced, and to gauge how much of an issue these caused.

From there we moved on to a problem/solution test format, showing them our prototyped ideas and discussing with them if they saw value in the concepts, if they could see it solving the problems they face, and how it would compare to other tools and substitute to do this.

‍

Screenshot showing how players input golf shot data

This prototype offered a simple overview and the ability to go deeper into key metrics, a typical dashboard approach. We quickly found that this was of low value, with founders happy to get these metrics from existing dashboards in their respective tools e.g. Xero, Stripe, Analytics.

‍

Screenshot showing how players input golf shot data

Here the app walks users through the process of combining data from multiple sources to create a cost of acquisition metric, giving them guidance and an understanding of metrics that usually have to be calculated manually.

‍

Screenshot showing how players input golf shot data

This flow offered a potential solution to understanding the impact of business decisions by allowing users to look at correlations in their data for a high-level understanding of what impact what. In this example, does ad spend correlate with any increase in revenue?

πŸ‘‰ We also tested solutions around sharing metrics and data, as well as projections into the future. However, I haven't included the screens here as that work was done by my talented colleagues.

Round one results: eliminating options

We got some very helpful information from this round of testing, however, the clearest feedback we got was feedback that enabled us to eliminate ideas. An example of this was the strong feedback that there was no value in repeating information from existing platforms even if we were aggregating from multiple platforms.

Other insights lined up with our assumptions around problems and features, like founders struggling to pinpoint what is working and having to do manual data manipulation in excel to get particular metrics. Features that offered to solve these problems (calculating metrics, correlating data, and suggestions on what to calculate or correlate) were the most well-received, however, they weren't runaway winners.

We also picked up some very practical insights, unique to our new target market of tech, such as the need for a Stripe integration, and that a desktop-first approach would be best. This helped inform our second round of design and testing.

Theming the results of our round of interviews based on our assumptions from previous research and knowledge.

Theming the results of our round of interviews based on our assumptions from previous research and knowledge.

πŸ’‘ Additional example insights:

  • ‍Founders almost always use their laptops for work, meaning the existing focus on the mobile app would be misplaced for this target market.
  • We would need to add multiple new data integrations to meet the needs of tech businesses e.g. Stripe.
  • Founders saw no value in aggregating metrics and data, they felt like that was easy to get from their respective tools.
  • Almost all owners used various spreadsheets to analyse multiple data sources and calculate particular metrics. Many mentioned how long this took, possibly indicating an unaddressed problem.
  • Owners wanted to better understand how different metrics were related, although whether Vonto could deliver this in sufficient detail was an open question.

Back to the drawing board

We'd learned a lot from our first round, but while we had refined our direction we hadn't found a winning solution or value proposition yet. We returned to a period of iteration, building on some of our existing features, as well as introducing some new features that we felt may better address the identified problems. These new features included positioning changes around our suggestions: organising insights and metrics according to pressing business questions e.g. "Are we targeting the right customer?"
Web main dashboard screenshot
Find relationships screenshots
If nothing else, this project made me very familiar with remote testing

Results: A disappointing second round

With the second round of testing, we had hoped to refine some of our promising solutions and offer new secondary offerings to create a winning set of features. Part of this testing was therefore to rank and rate our key offerings so we could gauge interest. Through the testing, discussions and rankings it became obvious that while there were aspects that interested founders more than others, none of these options was enough to really excite them and give us the confidence to move forward with a particular direction.

‍

The biggest realisation of this phase was arriving at the conclusion that we were going to be able to take the testing of a value prop with example content. While we were testing a range of features that weren't strictly content-dependent it was obvious that Vonto would need to prove its ability to generate valuable, personalised insights to truly gauge interest and value for users. A typical response being: "This would be really useful, if it really can provide what it's promising, but this example isn't really relevant for me".

‍

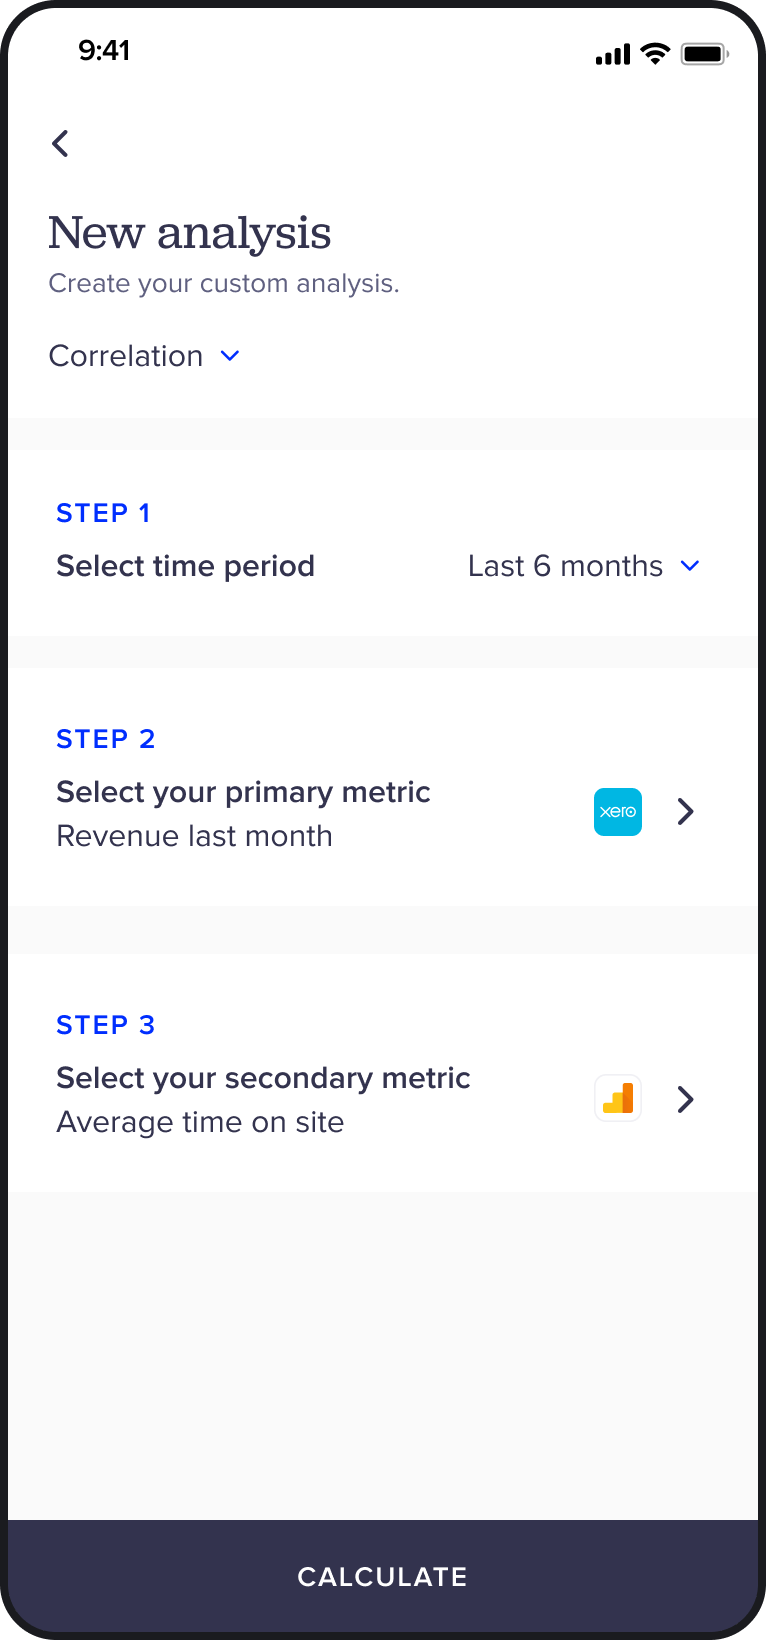
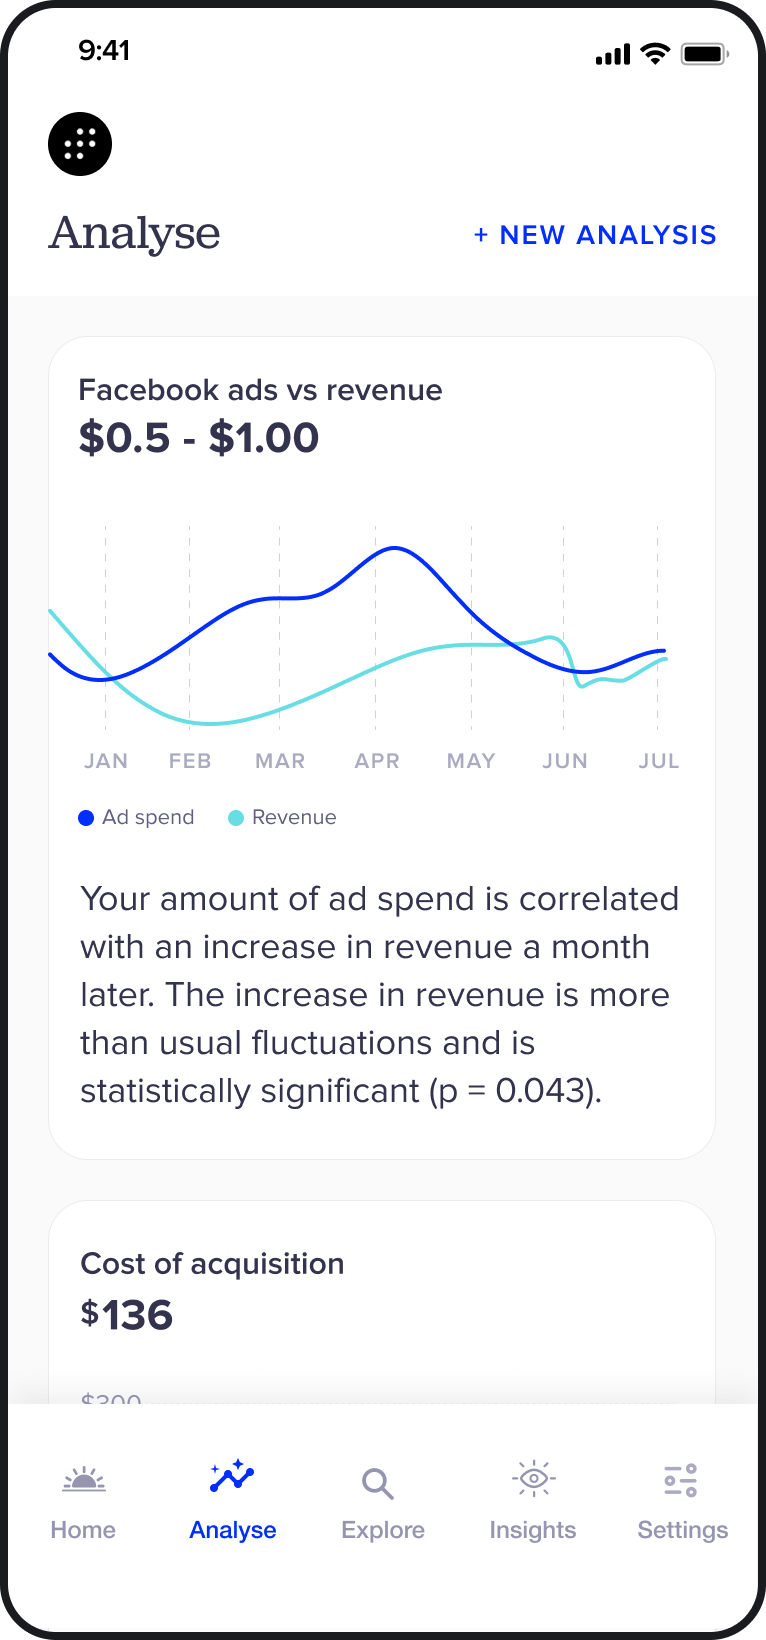
Features like manually being able to create correlations, calculations and other data querying tools were interesting and some participants had previously looked for or tried competitor tools in order to better understand their data. However, without being able to demonstrate truly impactful insights based on their data the potential value of Vonto was much less obvious.

Testing results image

Clarifying our key value prop

From this round of interviews & testing, we also clarified some of our thinking around the key value prop of Vonto. From previous research, Vonto had identified four key value props:

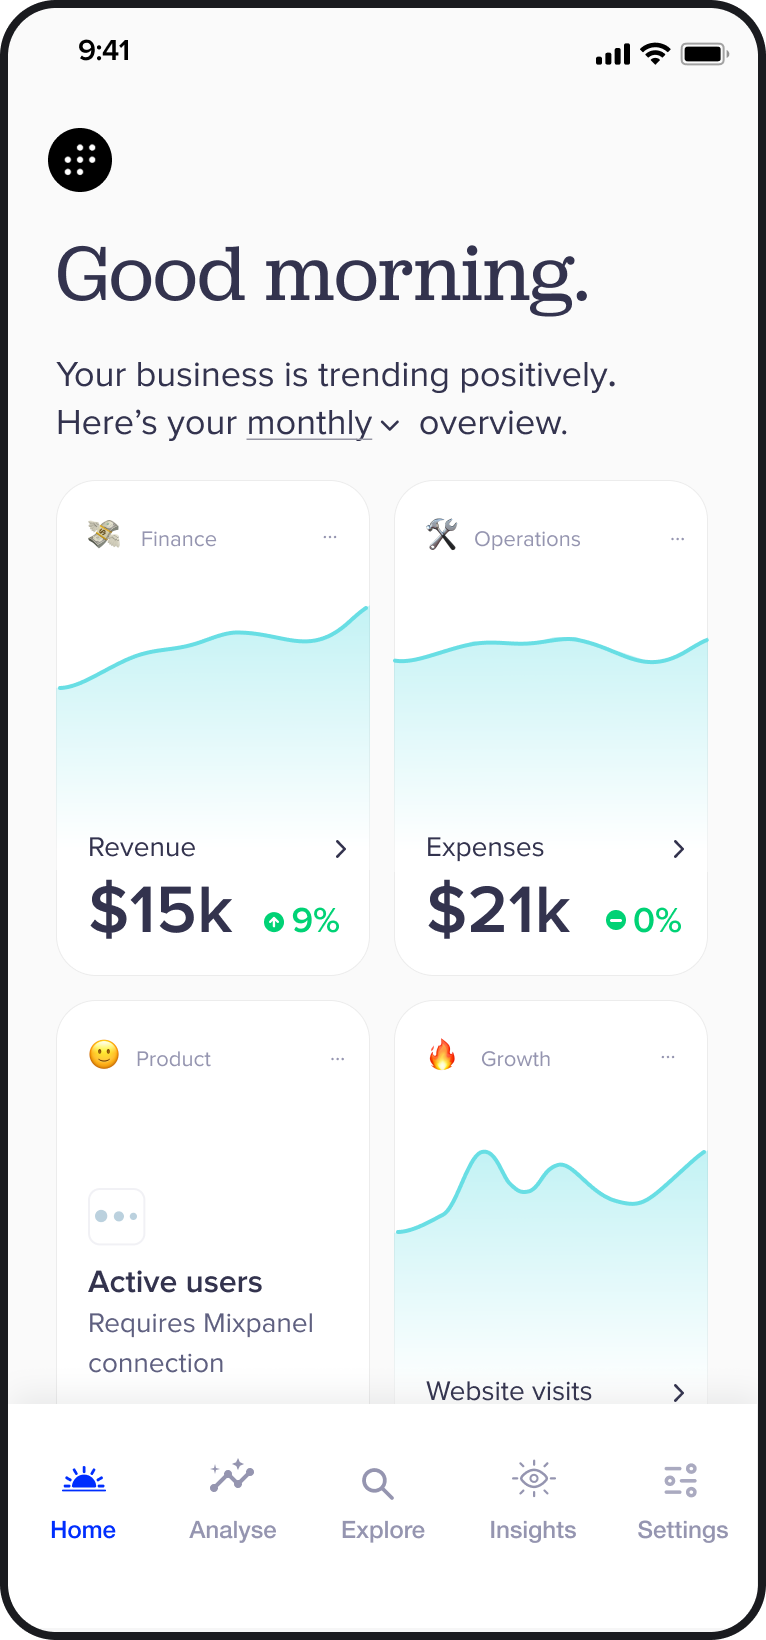
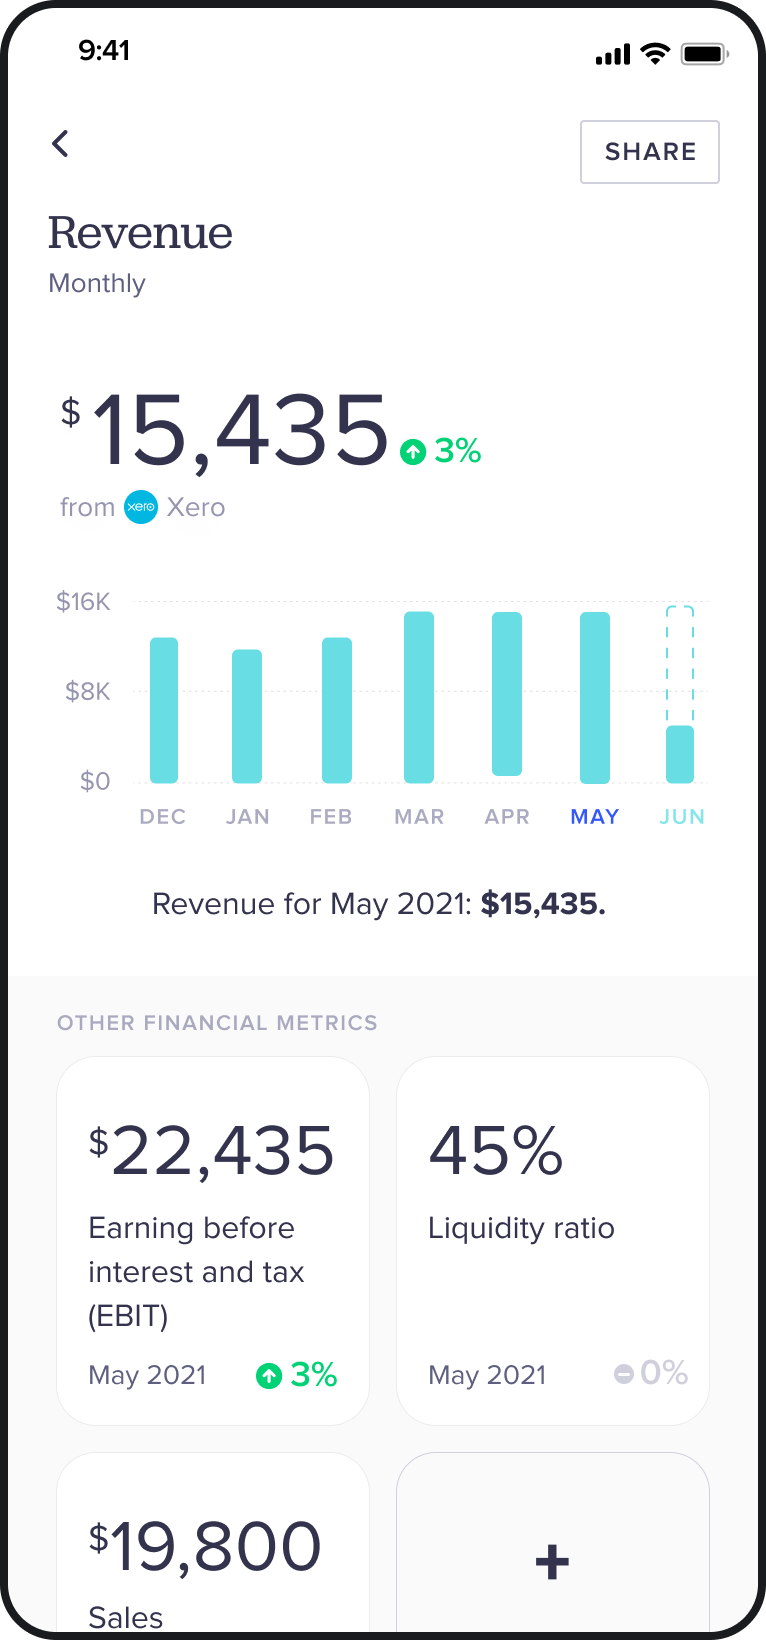
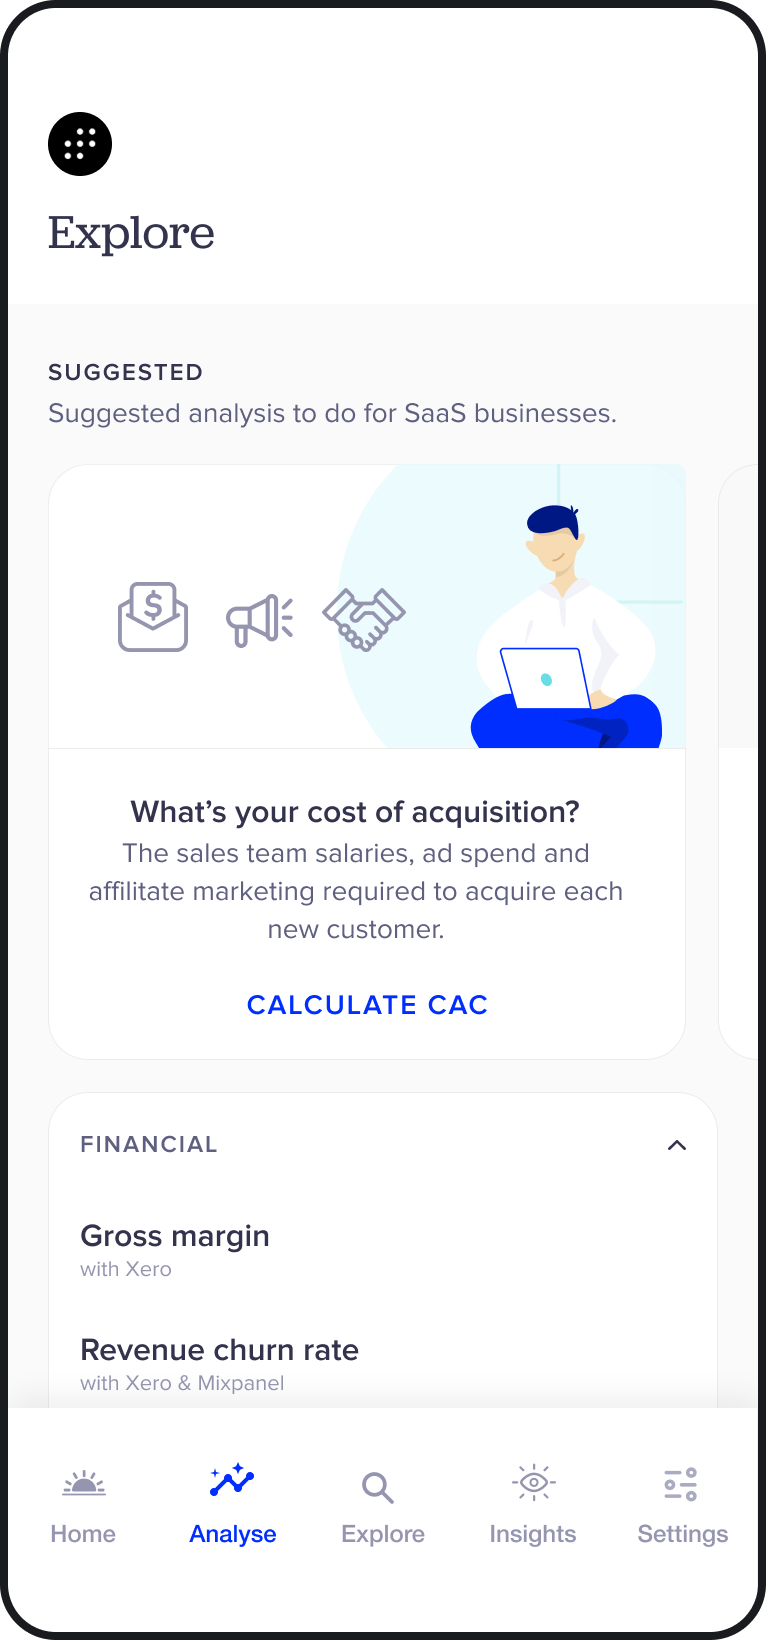
  • Aggregated view, a one-stop-shop for business metrics
  • Simplify complicated metrics
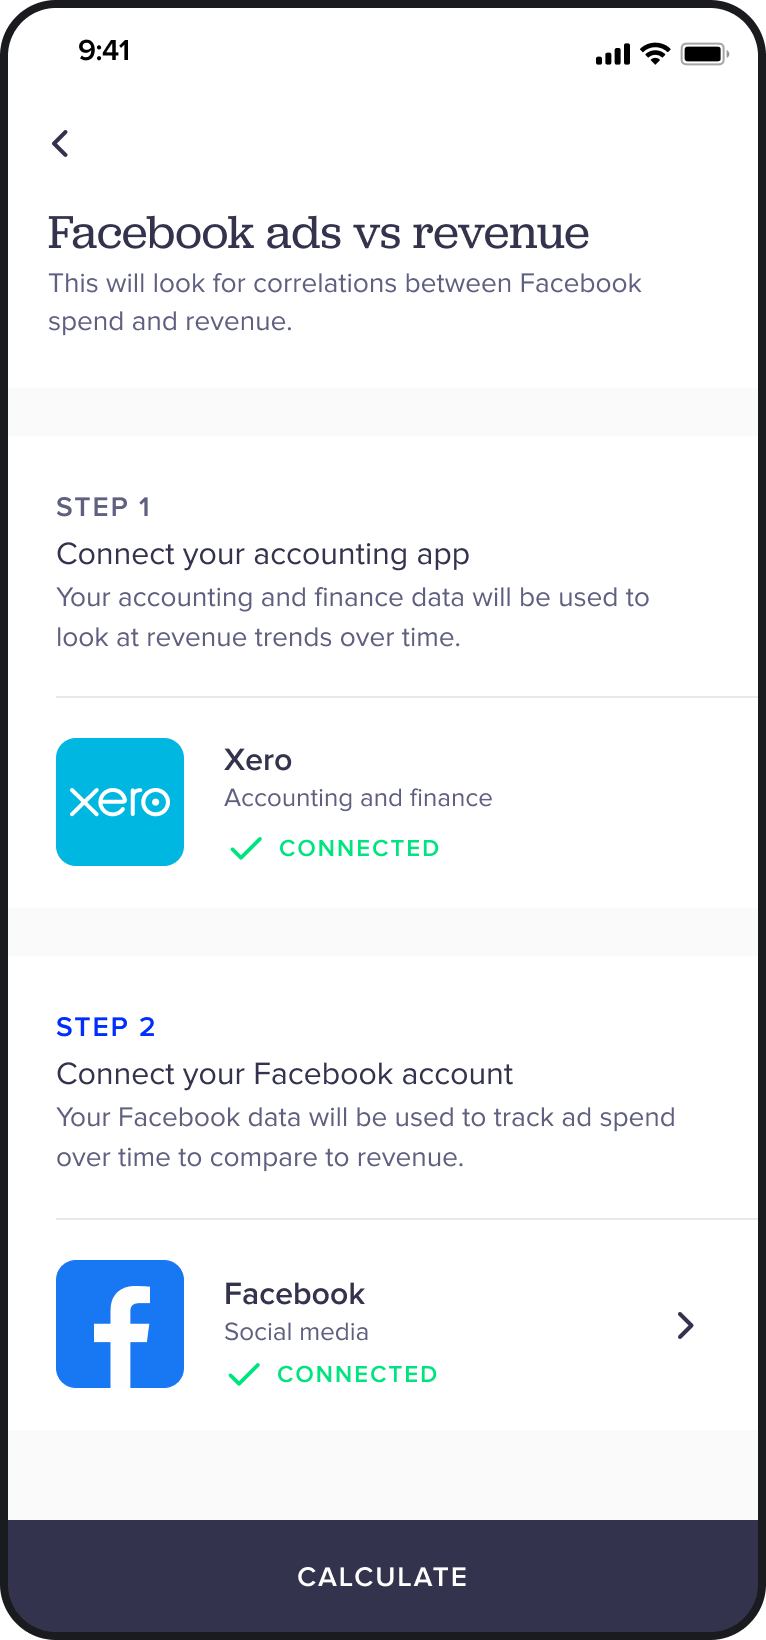
  • Novel insights by combining multiple data sources
  • Action insights right from the app

After these two rounds of testing we had seen strong evidence that, at least for this target market, the primary value proposition was to form novel insights by combining data sources.

‍

This informed our design work but more importantly formed our underlying recommendations going forward. The highest priority recommendation being:

  • Work with a data scientist and other experts to analyse real business data and form some of these insights.

This was important both to prove they were possible to create with the data available and that they were valuable and actionable to business owners. This was luckily already happening to some degree, however with limited access to real data from tech startups and with less familiarity with key tech tools like Stripe.

Moving on and lessons learned

After this research and testing my role began to be scaled back, beginning to hand over to Vonto's new internal designers. This meant that my end deliverables ended up being recommendations and a smooth handover of designs - rather than a final set of screens or product strategy.

I was disappointed to finish the project without a clear direction formed. I felt that the direction we had arrived at was still unclear on priorities and with several questions and risks that we hadn't effectively addressed yet, such as if we could actually deliver insights of as high value as we were hoping for.

‍

Our parting recommendations
  • Prove the value of insights by working with a data scientist to pull novel insights from real businesses data in the sector.
  • Minimise effort in the aggregation of metrics - a low-value offering
  • Use manual data query tools (like correlations & calculations) to back up automatic insights allowing interested users more free exploration of their data
  • Continue work on sharing key metrics. Sharing with investors was a task we identified in the final round of testing as a time-consuming task almost all founders were required to do.
  • Don't over-invest in a sharing feature given sharing with investors is something relatively unique to the tech industry compared to other Vonto industries (retail & hospitality).

Lessons learned

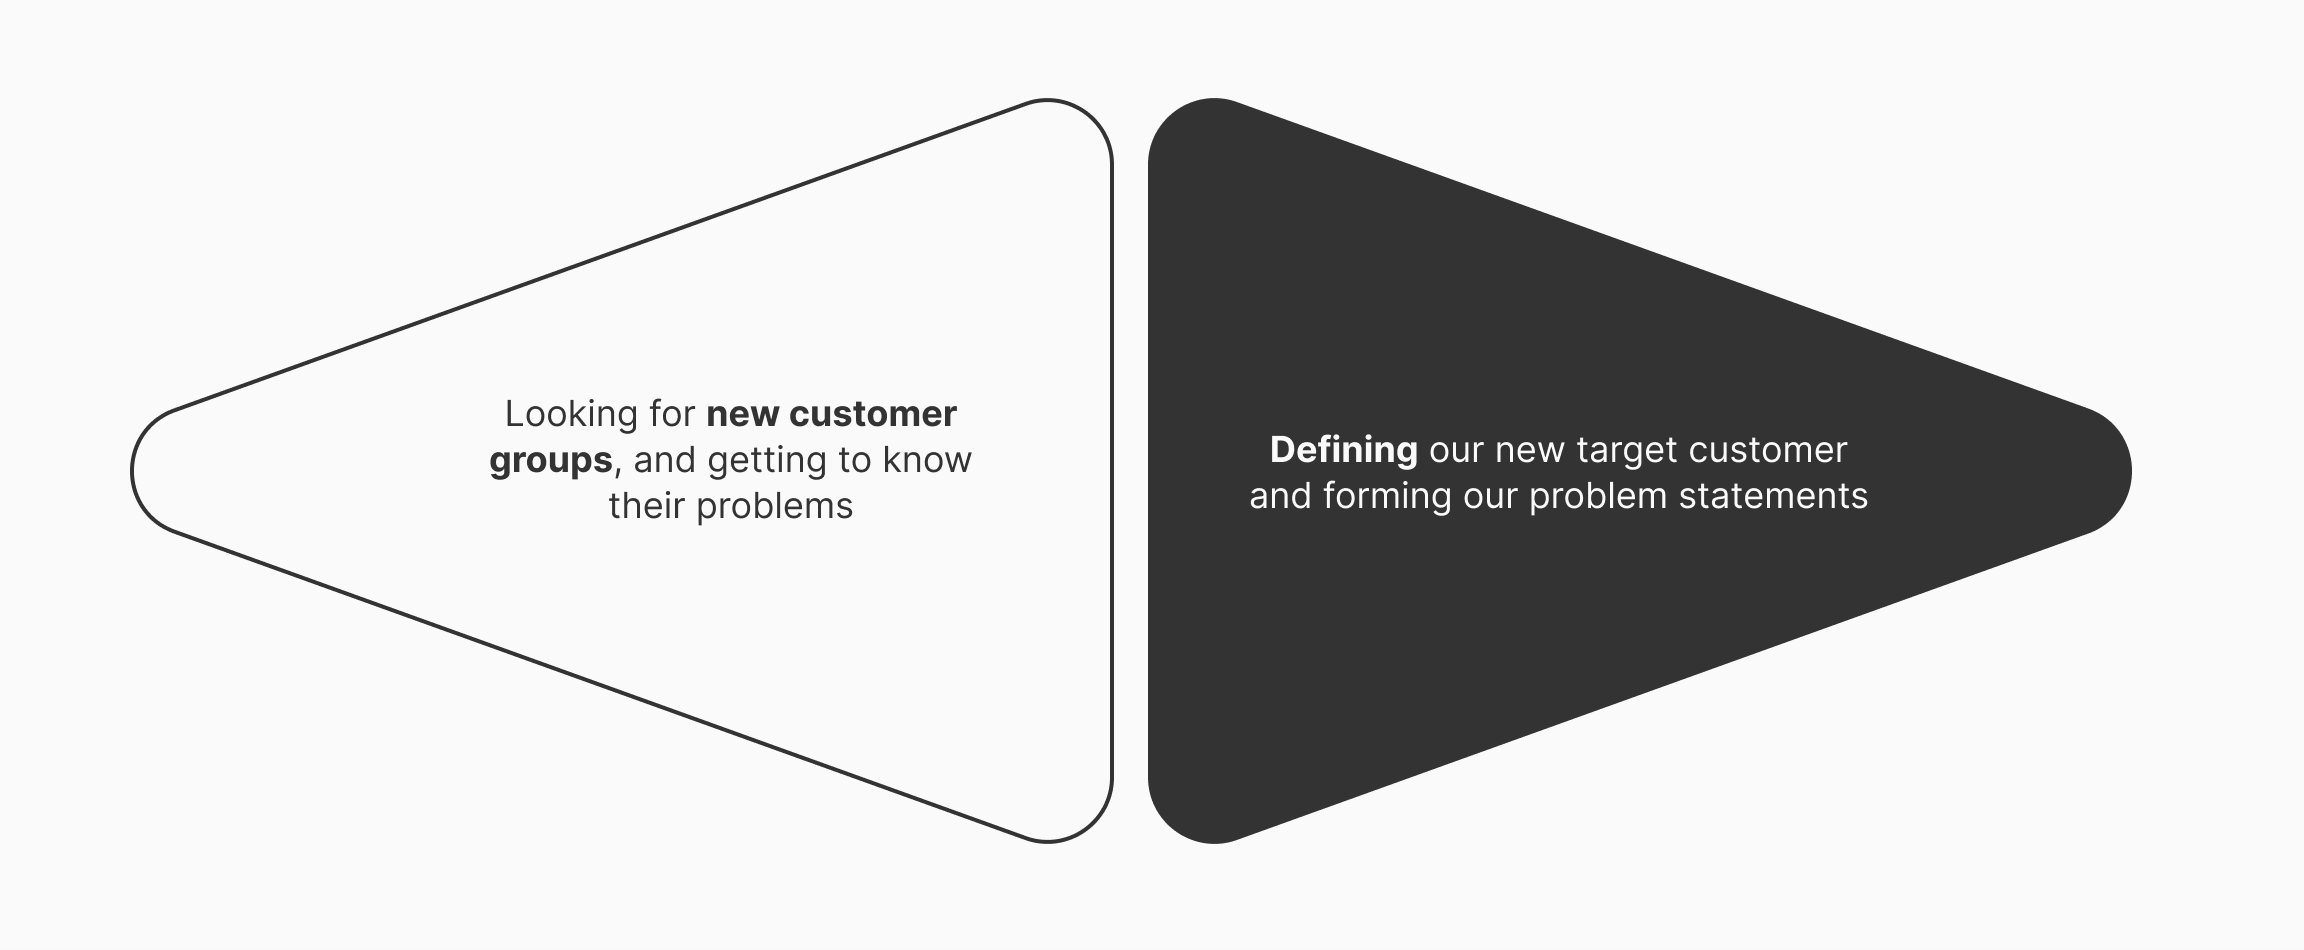
Problems before solutions

Starting with finding and validating a problem before moving onto a solution is a standard part of the design process, however, it's still common to have projects that end up being a solution looking for a problem. This project really made this obvious to me. Even though we were given an open brief, and were able to go back to a problem definition phase, we were still limited in our ability to validate or invalidate some of these problems due to the momentum behind the existing app. i.e. we didn't feel able to discard the core problems that Vonto looked to solve, even if we felt these weren't viewed as large issues by users.

Ensuring that the problem space is real and a relatively large issue at an early stage would have resolved this. Unfortunately in this case we didn't have the ability to influence the project during these early days.

‍

Start manual, then automate

It's very easy to get excited about the potential to automate certain tasks or rely on user-generated content when designing new products. This project highlighted the need to start with manual creation of the vore value prop in order to prove it was possible to create and highlight the most important parts of that process to automate. In this example, manually creating insights from real business data would have made the true insights Vonto was hoping to create much more obvious and provided a clearer path towards generalising these across businesses.

For all its frustrations, this project was a fantastic learning experience when it came to: product strategy, becoming very familiar with tech business metrics, applying lean product design principles, and simply getting another solid set of user interviews and tests under my belt.