IOG - Launching the world's most advanced golf training platform

The Institute of Golf is New Zealand's premier golf coaching organisation, we helped them develop a platform for elite players to understand, track and develop their golf game. I led design through the discovery, delivery and release in late 2020.
Product Design 
|
2020

Project background

Institute of Golf (IOG) has had massive success in its coaching business, coaching world champion Lydia Ko to multiple wins as well as working with many other top-ranking international players. To expand their business outside of direct 1-1 coaching, however, they decided to pursue a strategy of digitisation of their coaching process through a new platform.

IOG came to Roam having already built a coaching platform but while this provided some valuable insights it was not appropriate as a self-service digital product. This existing platform enabled IOG to capture player data, and then create manual coaching reports however this was a manual process that would be difficult to scale further than an expensive service for national level golfers.

We took this starting point and working with IOG, designed an MVP that integrated their extensive knowledge and manual processes into an easy to use platform for players.
Image of previous reports done by IOG

An example of the manual data sheets and reports being produced - confidential information redacted

Discovery

The discovery phase started with workshops and an effort to bring together the expertise of IOG & Luma (data analytics), review the competitive landscape and interview players and coaches before moving into prototyping and testing.

I facilitated these initial workshops to set project goals, and frame the problem with our initial assumptions around who our key personas were, what their main problem was and why this was impacting them. The problem statement we formed here helped inform our research and was something we set out to validate as quickly as possible.
Problem statement: Players are lacking data and benchmarks to track performance. This prevents effective training.

Problem Statement: Elite players are lacking data and benchmarks to track performance against. This prevents effective training.

Understanding the world of elite golfers

Elite players were selected as our primary persona to focus on, with a secondary persona of top coaches. This was for a few reasons:

  • IOG had good networks with these players already
  • There were indications of demand from these players e.g. paying for data analysis from IOG
  • Less product competition targeting this demographic
  • It would provide a good marketing angle when expanding to amateur markets

We interviewed top-ranking NZ players, top U18 players and a professional caddy to gain insight into this demographic. We learned some interesting things that were essential in tailoring the end result to their context:

  • Players often have strict limitations on the technology used in tournaments i.e. no phones
  • Many players were not familiar with some of the statistical methods we'd be using to analyse their performance in more depth than current common statistics
  • Players were often not tracking their practice (either practice rounds or practice on the range), instead of relying on feel to guide practice

Alongside these findings, we also had found evidence in support of our problem statement, with players talking about the current time cost and statistical limitations associated with using existing tools. The younger players and their parents also talked about trying to understand the benchmarks or steps to achieve scholarships and bigger tournament entry. They found it hard to understand current performance with only local courses and competitions as a gauge.

Minimum viable product

We designed and tested a slightly wider range of features than we expected would make it into an MVP, enabling us to gauge relative need and roadmap past an initial launch. This also enabled us to help develop the pricing model alongside IOG with a freemium model and premium features as a starting point.
Player performance breakdown
player performance breakdown - screenshot

The main area of IOG is a dashboard breaking down a players performance. We found that players were familiar with the dashboard concept from other products making this an effective starting point. However, we wanted to address a few key points based on our initial research and early prototypes:

  • Reducing volatility and distraction
    The coaches (and some players) talked about how important it was to watch overall trends and stick to a plan, but how easy it was to get thrown by a bad or exceptionally good round. We introduced the concept of a 5 round rolling average as the main visual element of the graphs, making trends more obvious and reducing the emphasis on single rounds.
  • Communicating benchmarks and clarifying statistical methods
    One of the new statistical methods we use is called Strokes Gained. This is a relative benchmark, meaning that performance is always shown as the difference to a selected benchmark e.g PGA tour average. We improved understanding of this with players with a simple goal progression graphic, a written overview of where a player is at, and showing two benchmarks - a baseline (either amateur or pro) and a goal - showing how these relate and the gap between them.
  • Avoiding overwhelming players but allowing deep analysis if needed
    We used a number of hover tooltips and states (tap on mobile) that allowed us to hide a significant amount of information at first glance, and reduce the visual clutter at a glance. Enabling detailed hover stated on graphs allowed players and their coaches to view the scores of specific rounds and the difference to goal if needed.
Data entry
Screenshot showing how players input golf shot data

The data entry screen was an area we identified early on as a potential inhibitor of wider uptake unless data entry speed could be increased, possibly through integrations with golf GPS watches. However top-level players can't rely on these tools due to accuracy issues. For this reason, we designed a manual input screen to enable manual entry, but with the goal of making this as fast as possible with errors being caught automatically. This was paired with a paper score collection card, based on our initial research showing players not being able to use phones or other devices in key tournaments.

Logging practice

We also looked at a range of options to introduce the concept of practising into the platform. We saw an opportunity to guide practice sessions and track improvements around this. After several iterations, we adopted a similar manual input of data with a range of simple practice drills. This enables basic tracking and trend analysis alongside rounds, and set up the possibility for the development of more advanced practice plans and working with coaches in the future.

Connecting with a coach
Screenshot showing coach view of player dashboard

Connecting coach and player is an essential piece for players at this level. We spoke to coaches about some of their needs early on in the discovery phase. Our resultant design following testing focused on:

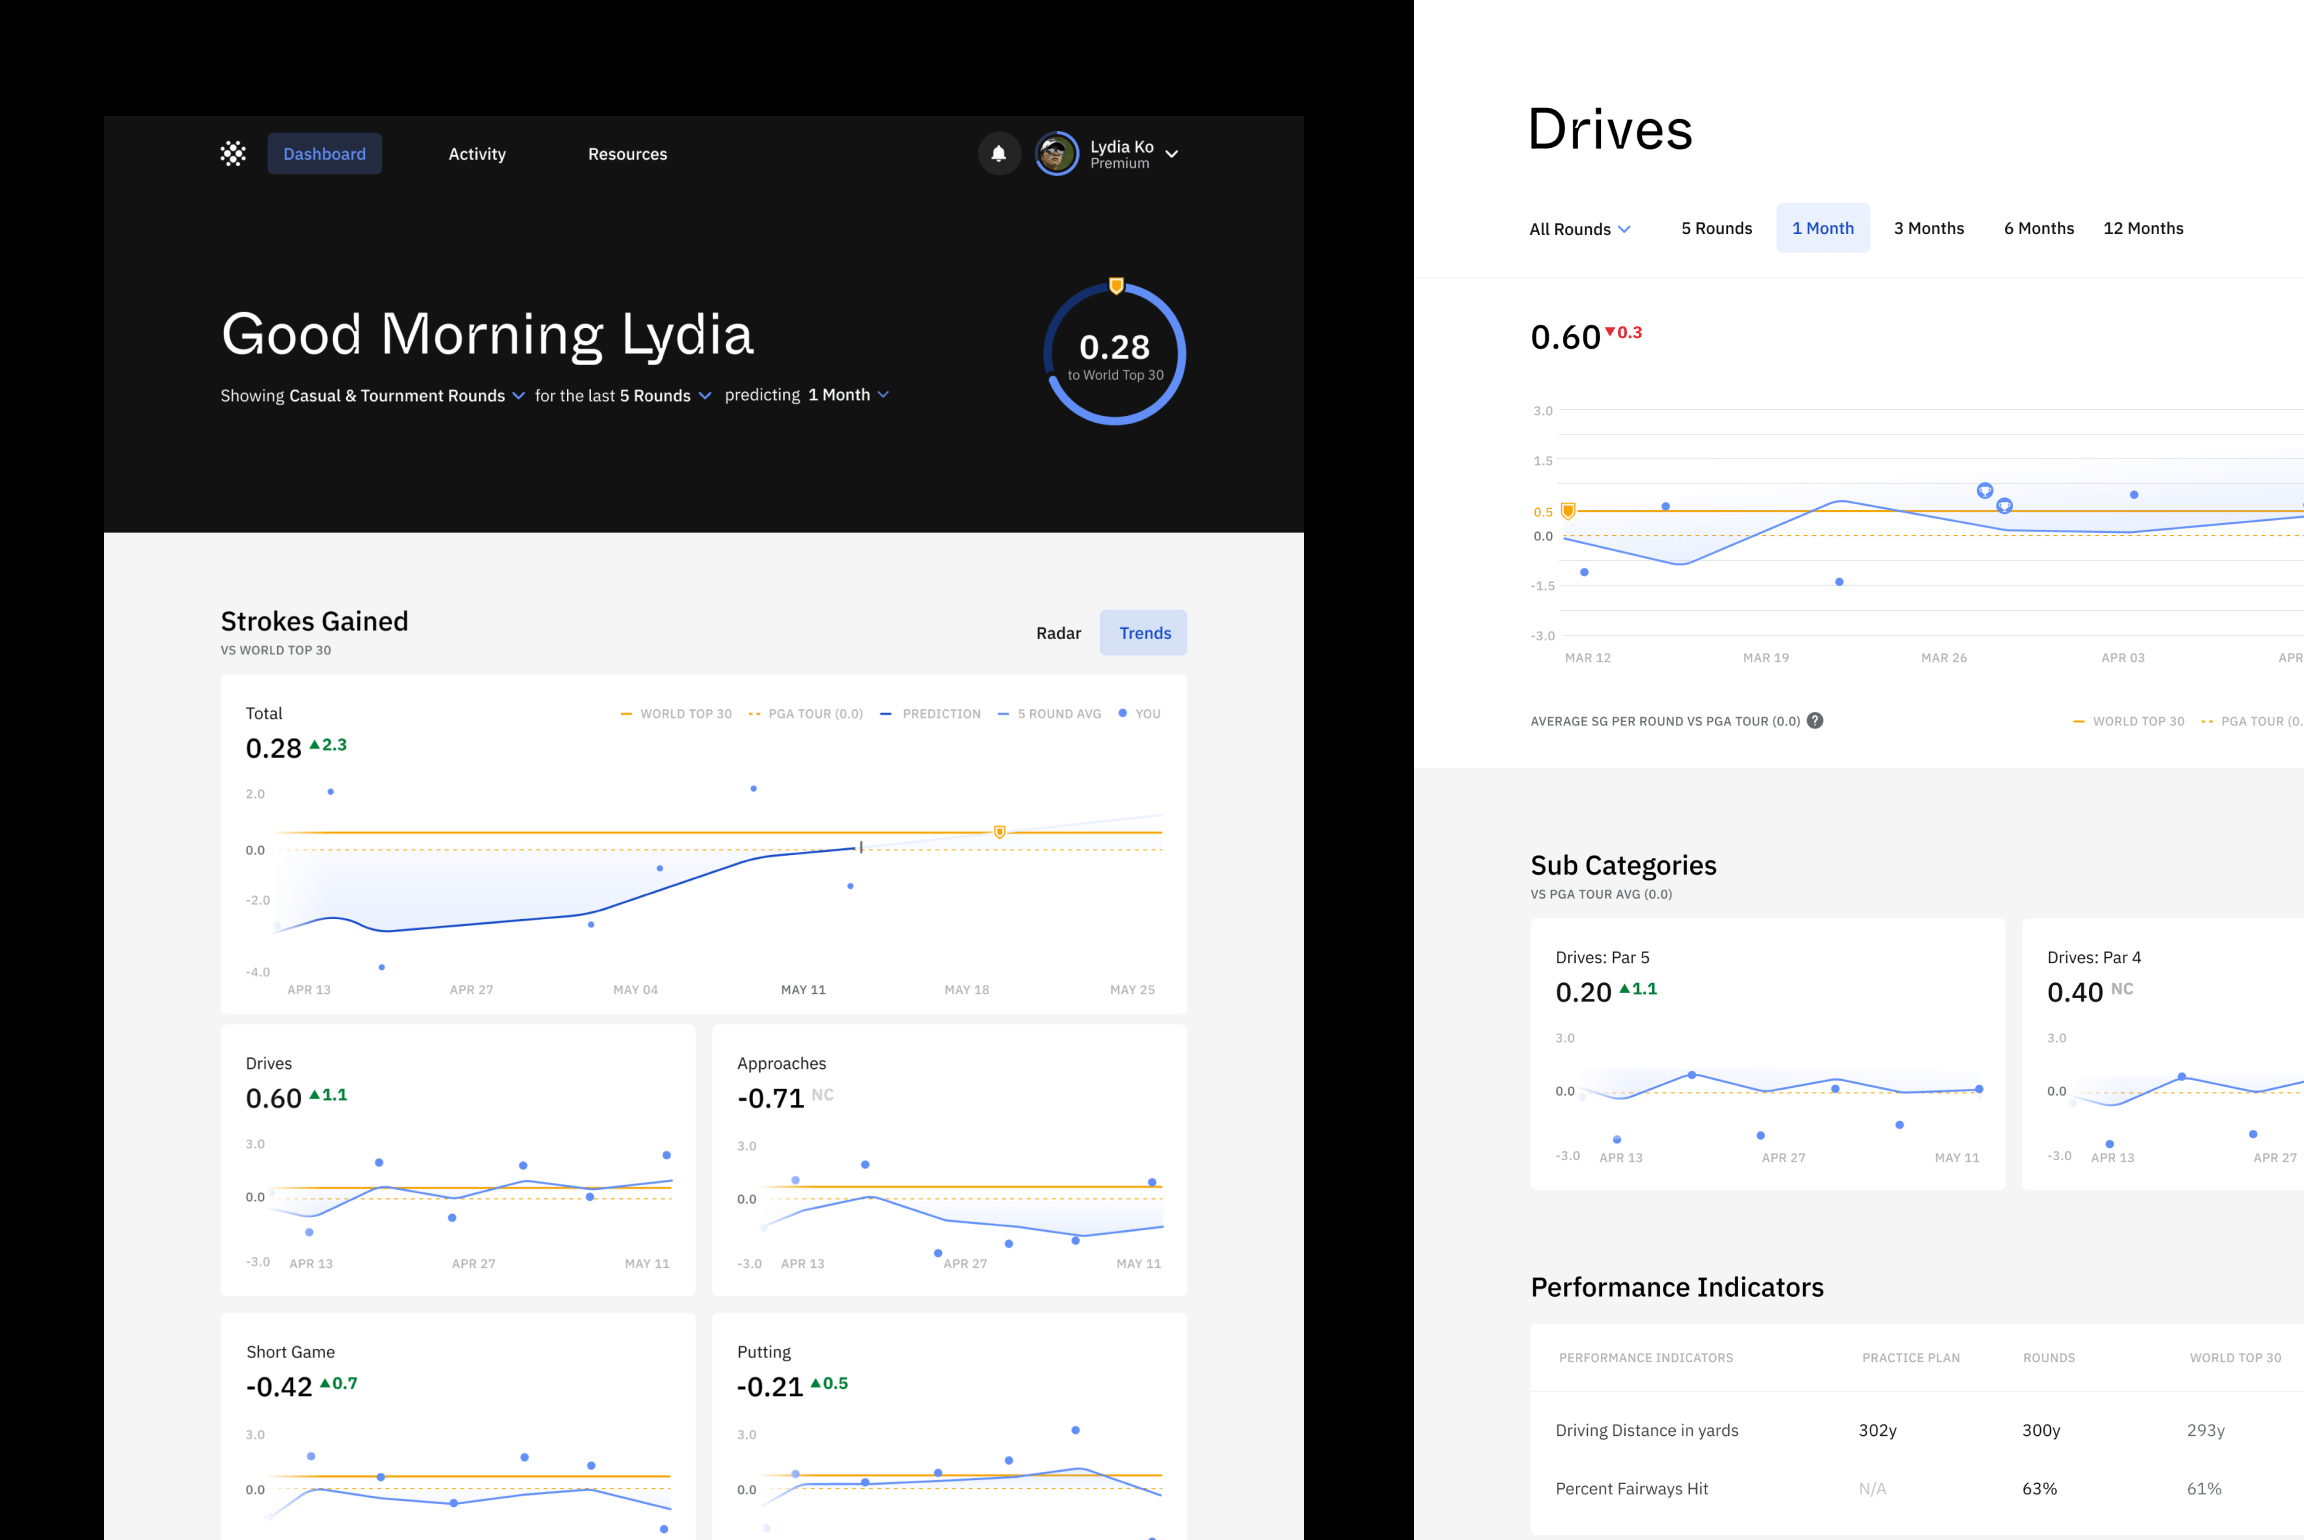
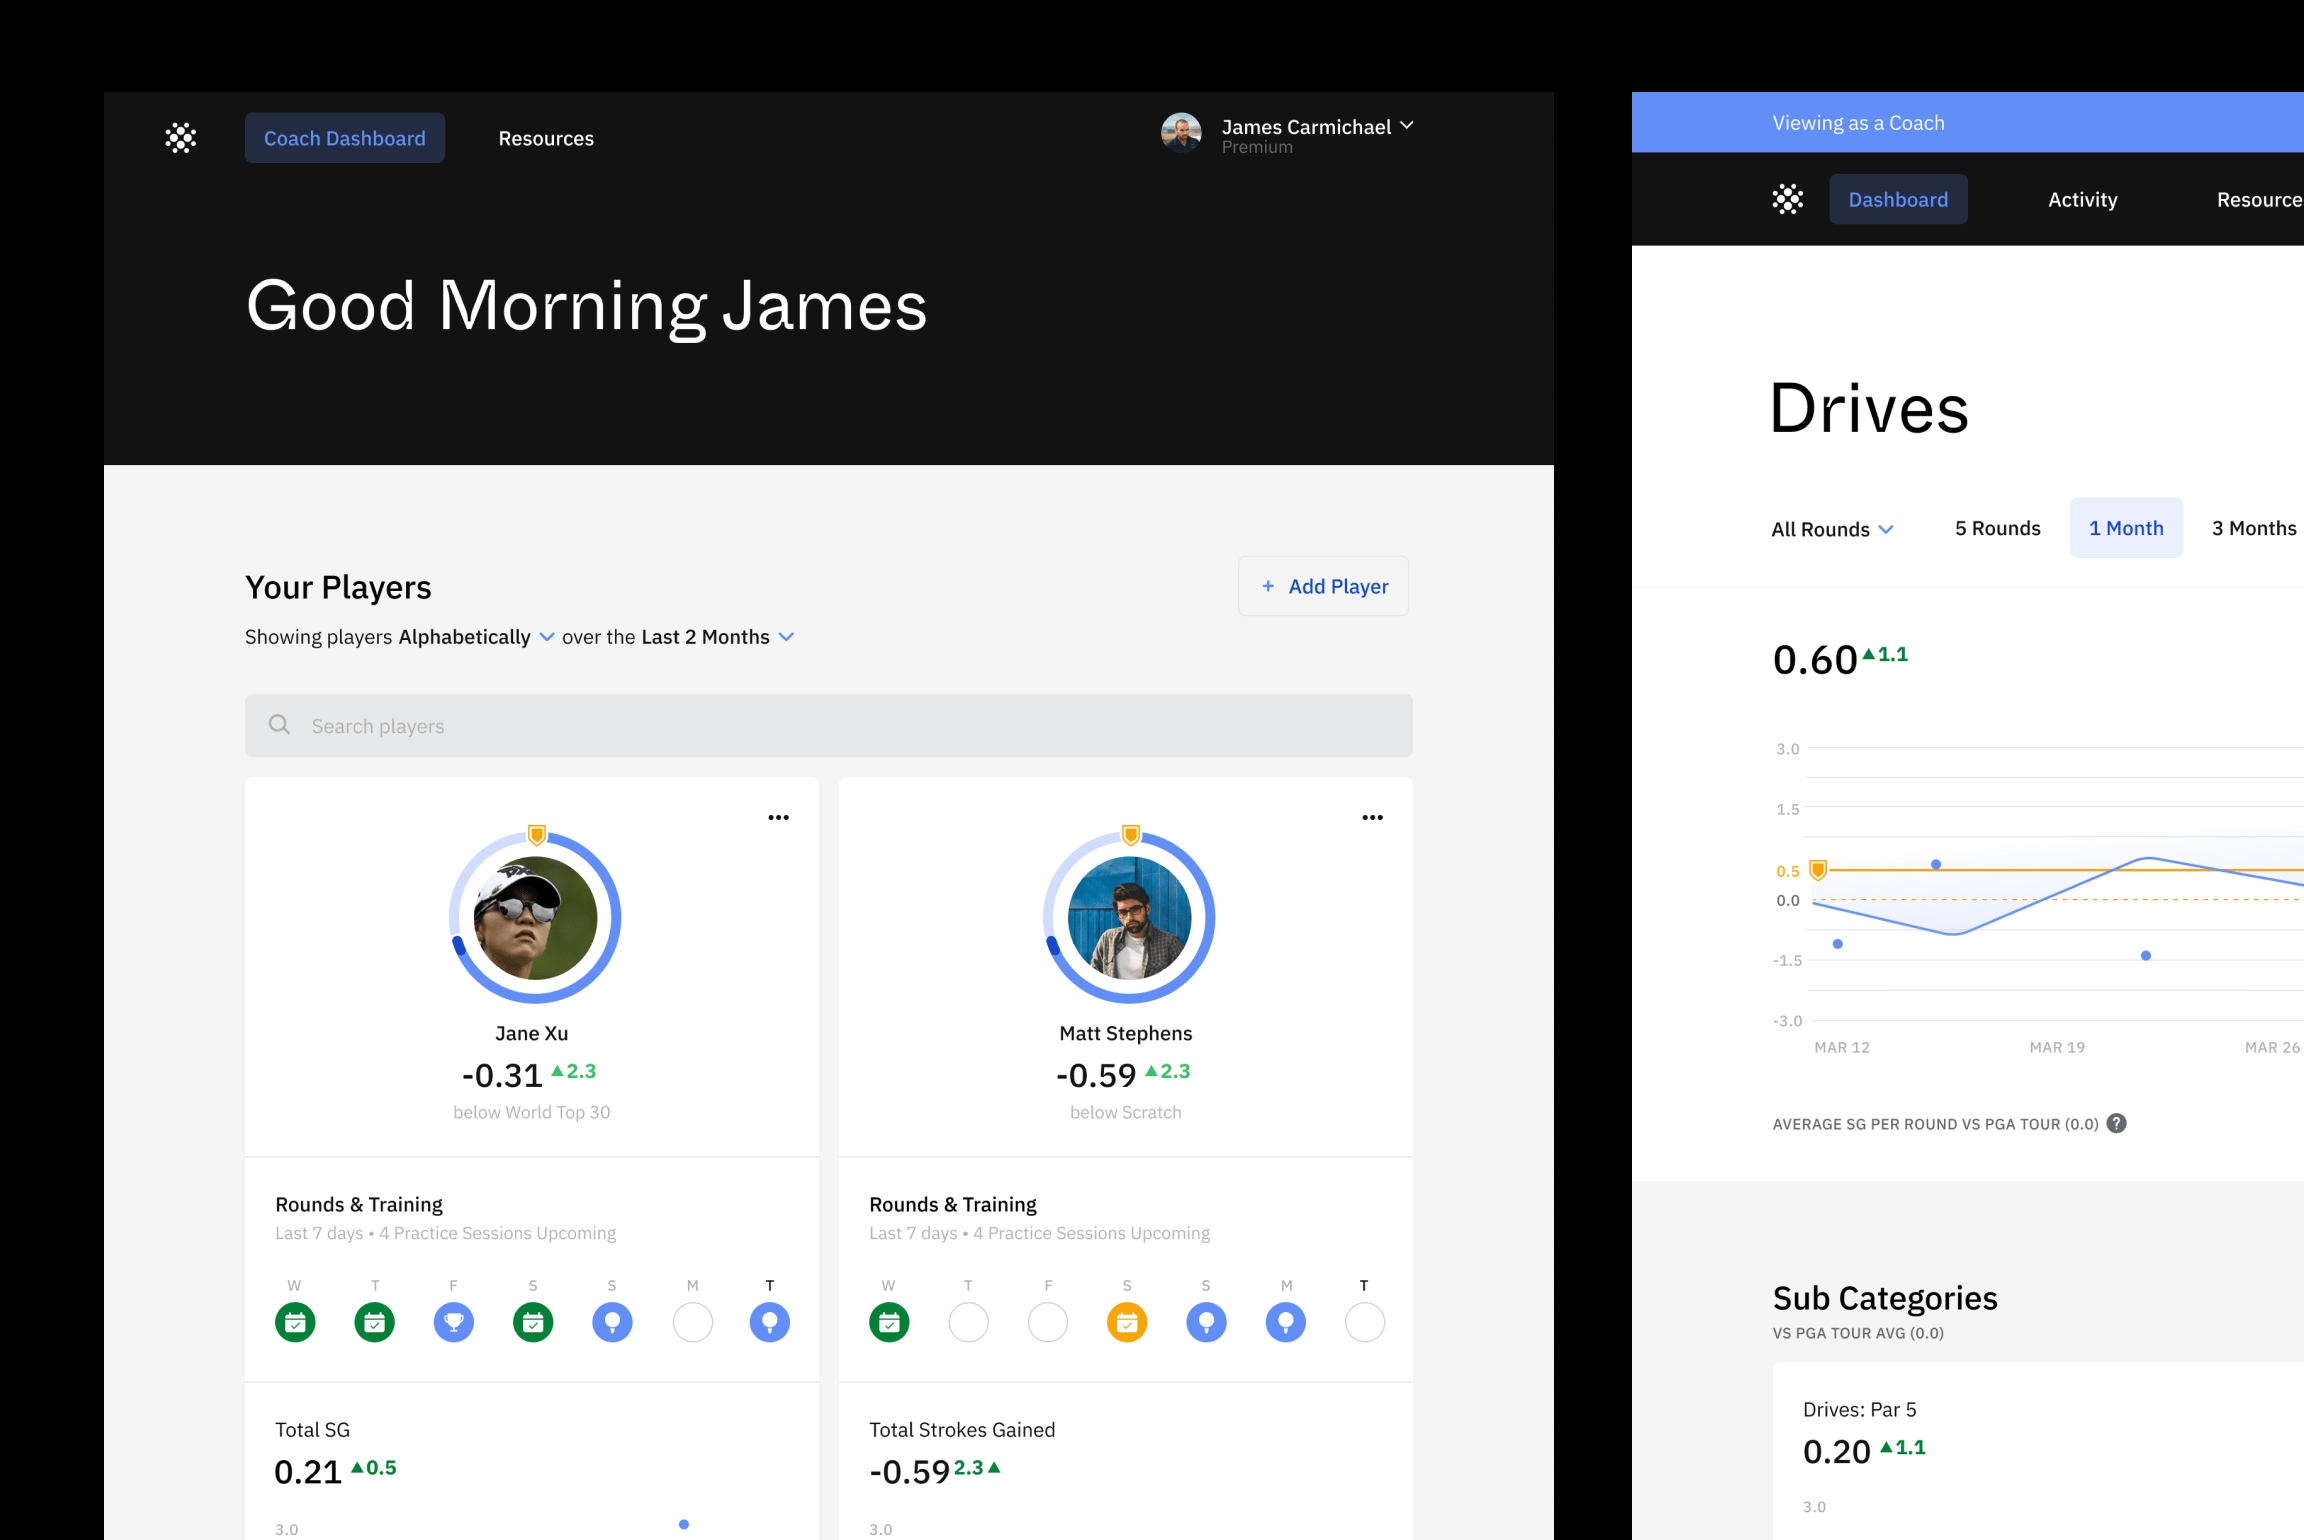
  • Giving coaches a quick overview of their players, allowing them to catch up on recent performances
  • Allowing the same detailed dashboard and trend views that players have

We chose to eliminate communication features, these were not perceived to be an issue with coaches in their current workflows and the range of communication needs were wide (sharing videos, translating Chinese to English, involving player's family in conversations).

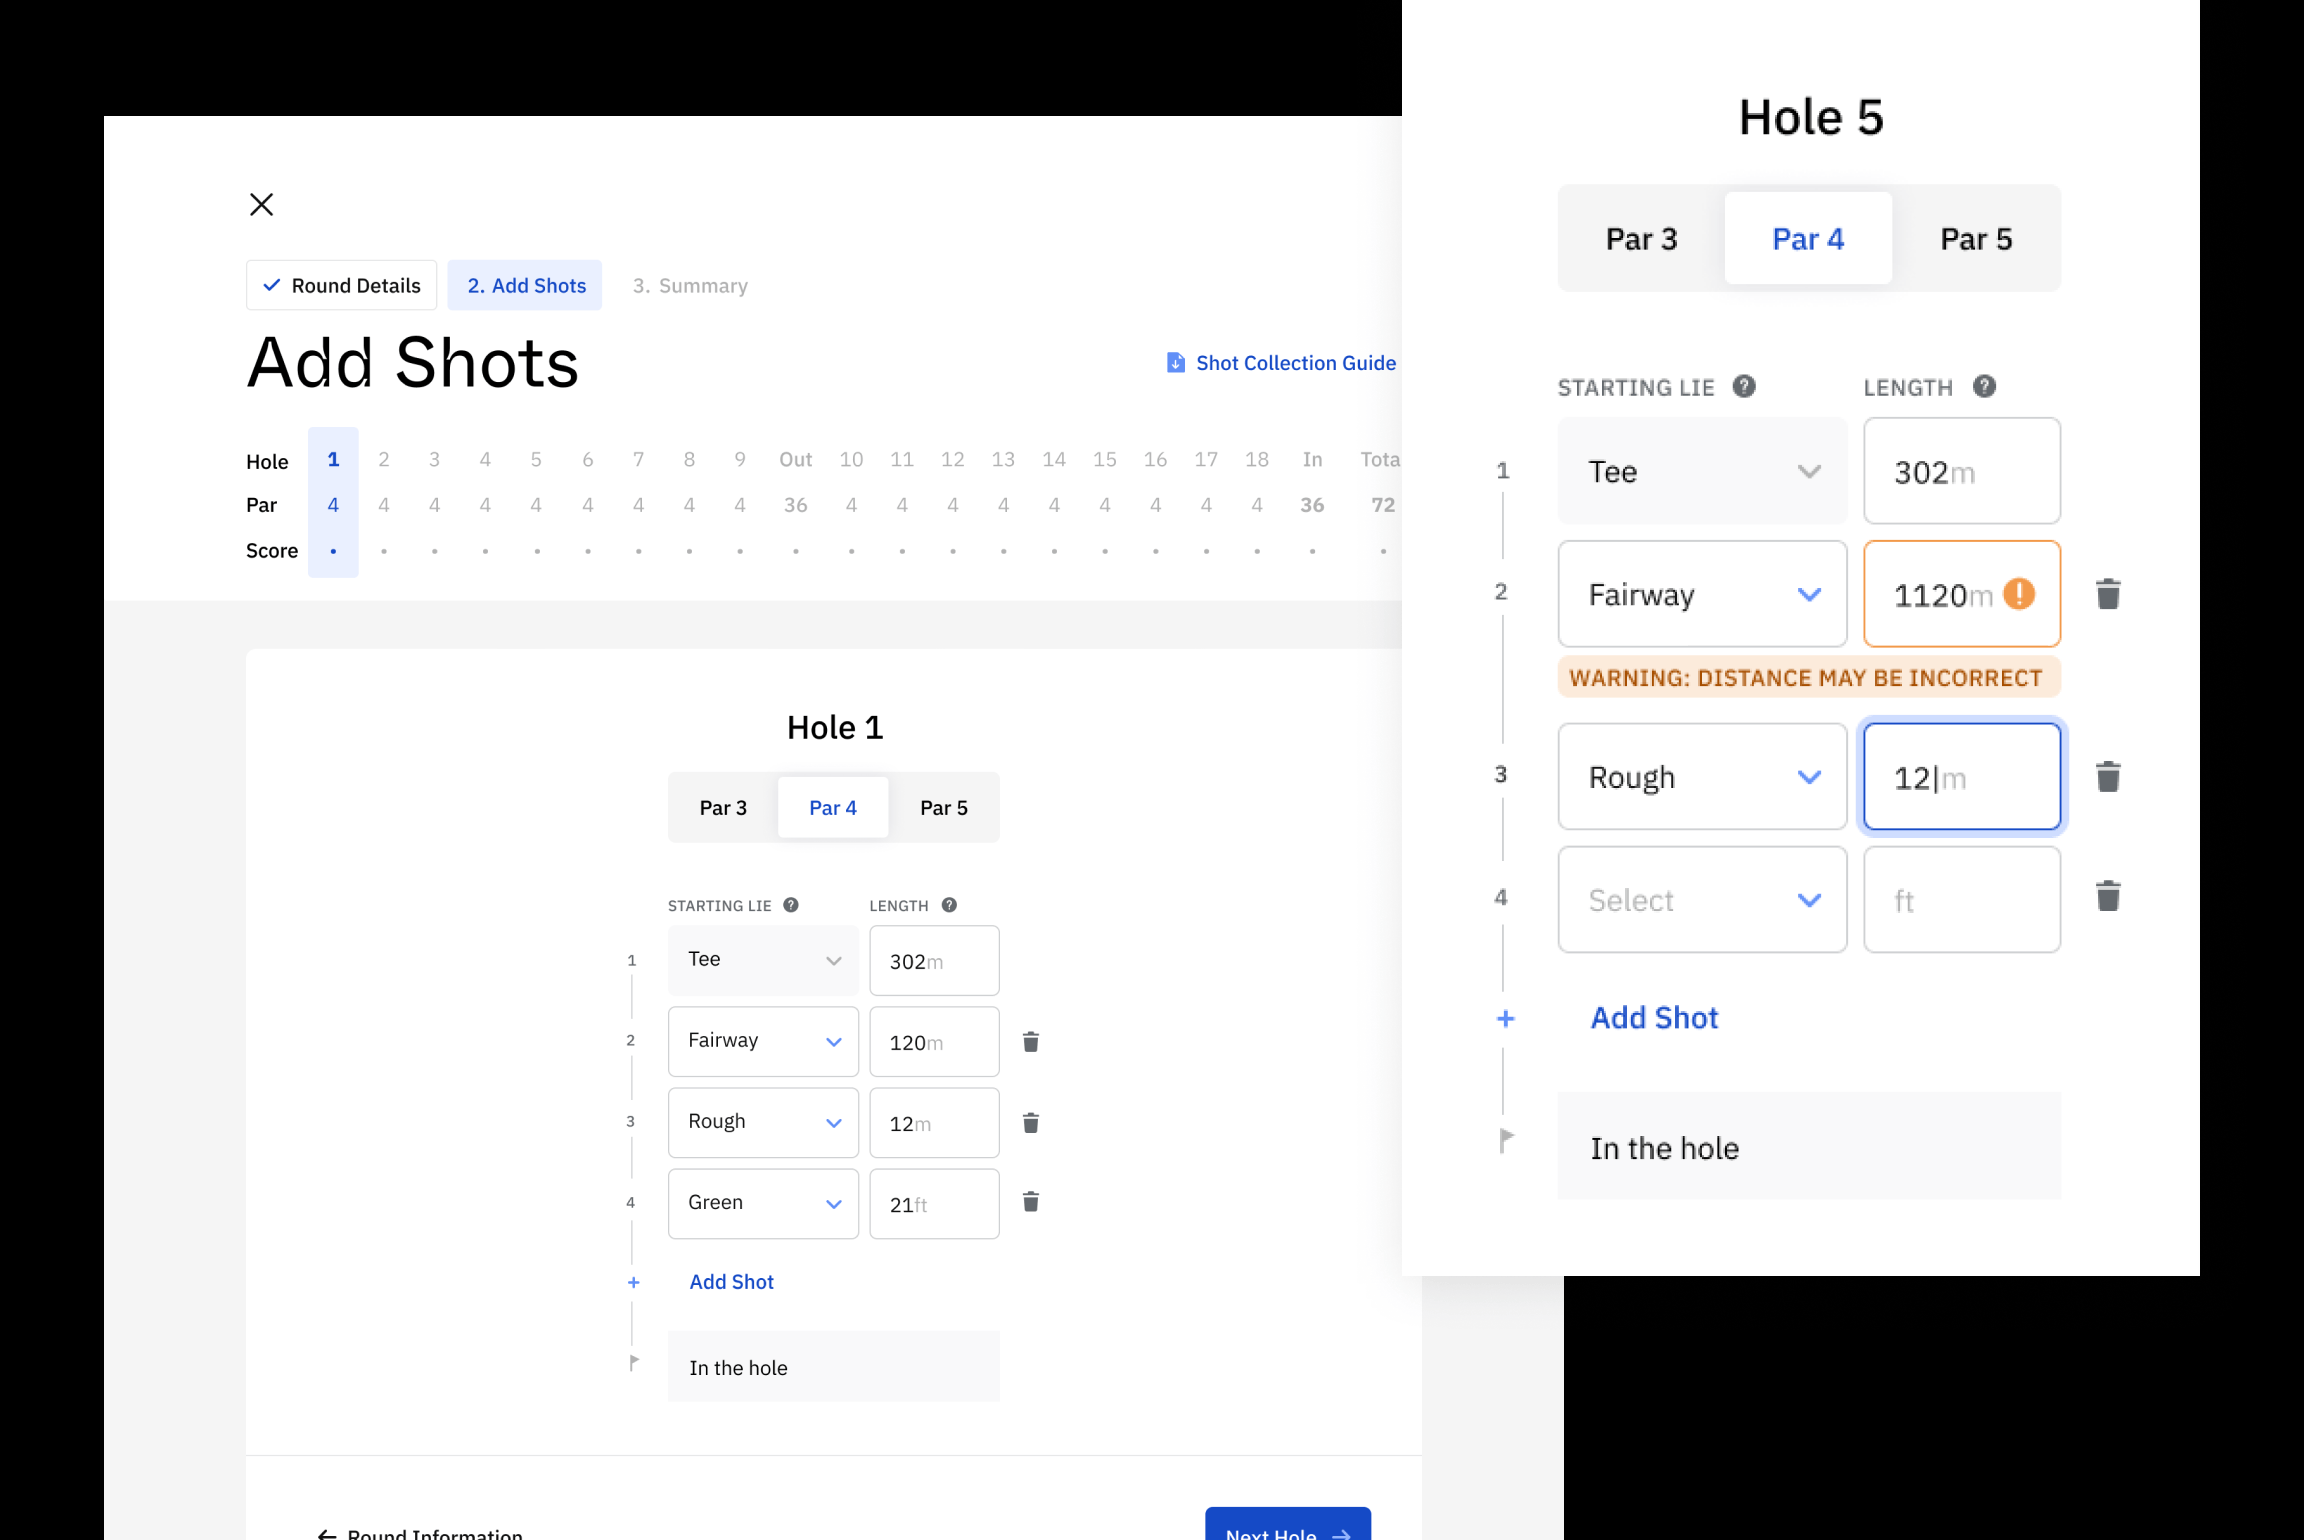
We also chose to drop the ability to customise practice plans, with the expectation that this would be part of a future release. By enabling the tracking of practice we expected that the main pain point for coaches, a lack of visibility over practice results, would be significantly reduced and provide enough value for a first version.

Delivery

Moving into delivery I remained involved in the rollout of a full UI and design system. Our discovery allowed us to refine our core offering, but following a rebrand by IOG delivery still required a large amount of visual refinement and completion of a wider range of screens and states.

Working with the development team at Roam, a branding agency and key stakeholders at IOG we successfully completed a release of a full platform in December 2020, including Chinese translations and a Webflow landing page.
Landing page
Landing page screenshot

Section of the landing page, showcasing the new brand and allowing rapid testing of copy and design.

Today

IOG is seeing strong growth, recently expanding into the US and soon to be expanding into China (as of writing)  The platform has been receiving great feedback from top-level players and coaches in its ability to provide for their demanding needs.

Some positive feedback from Client:
Sasha got a membership at the NZPGA earlier this year but we struggled to get her using the platform, as her terrible experience using other stats platforms turned her away from considering the idea of another. After she decided to give it a try, just got the feedback: "Ok.... I'm hooked. This stats summary and whole system is WICKED".

View website

Note that the product has now been rebranded to Draw More Circles.

https://www.drawmorecircles.com/